

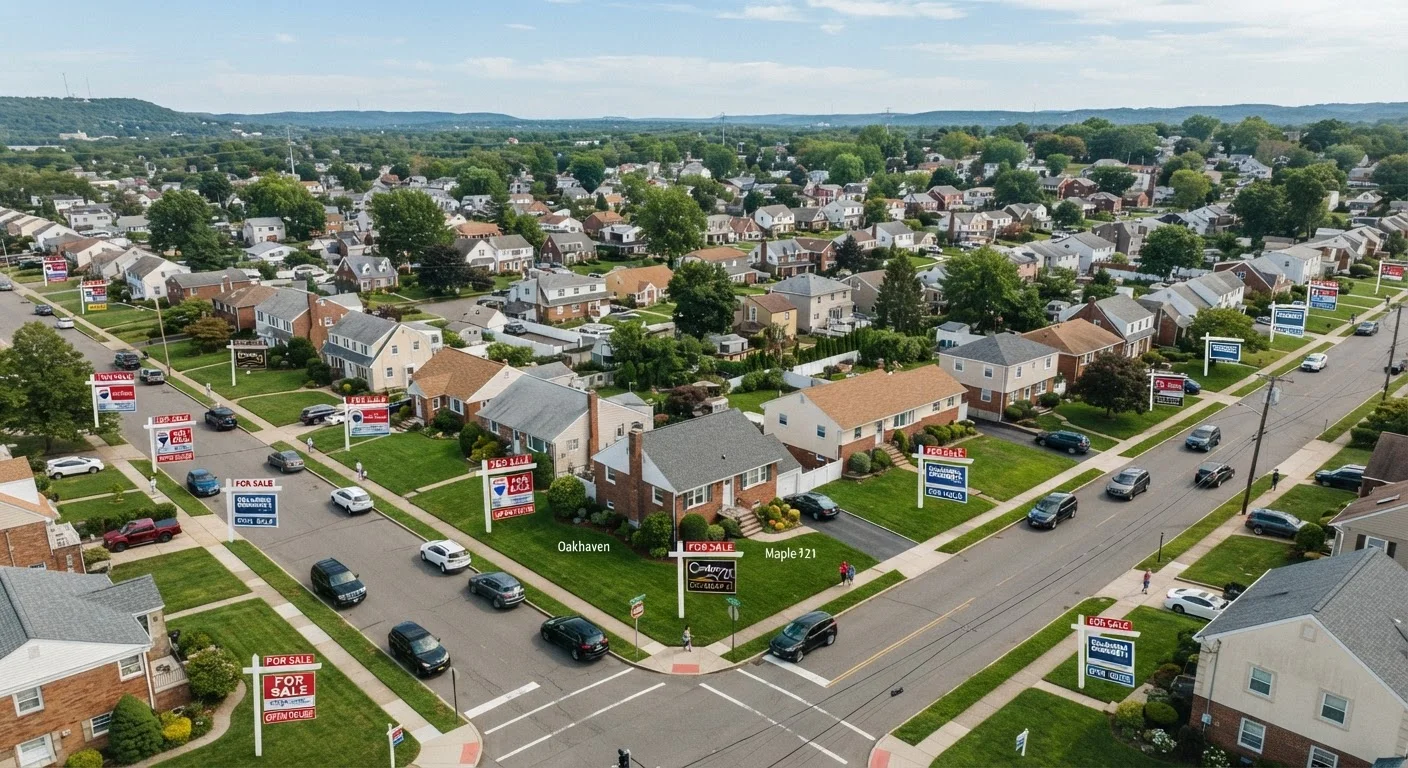
The Basic Mechanics: How Supply and Demand Move Prices
Every housing market - whether it's a major metro or a small town - operates on the same fundamental principle: prices rise when more buyers compete for fewer homes, and prices fall when sellers outnumber motivated buyers. This isn't abstract economics; it's what determines whether you'll face a bidding war or negotiate a price reduction on your next move.
Supply in housing is straightforward: it's active listings plus homes under construction that will soon enter the market. Demand is trickier - it reflects not just the number of people who want to buy, but those who are financially able to buy given current income levels and borrowing costs. A neighborhood can have enormous latent demand from renters who aspire to own, but if mortgage rates spike or incomes stagnate, that desire doesn't translate into actual purchasing power.
The relationship between these two forces sets nearly every other market metric that matters: median sale price, days on market, sale-to-list price ratio, and the frequency of competitive offers. Understanding this relationship is the foundation for making sense of any local market. See what drives home prices up and down for a deeper look at the specific forces behind these fluctuations.
Why Local Conditions Matter More Than National Headlines
National housing statistics are useful context, but they rarely tell you what's happening on the street where you want to buy or sell. A national average masks enormous regional variation - markets in the Sun Belt may still see intense buyer competition while certain Midwest cities have comfortable inventory levels simultaneously.
Local supply is shaped by factors unique to each community:
- Zoning and land-use regulations - Cities with restrictive single-family zoning limit how much new housing can be built, keeping supply artificially tight even when demand is high.
- Construction activity - Areas where builders are active can absorb demand surges more effectively than markets where new permits are scarce.
- Population and job growth - A major employer relocating to a region can rapidly expand demand faster than housing supply can respond.
- Geographic constraints - Cities bounded by water, mountains, or protected land can't expand outward, compressing supply permanently.
4-6 months
Supply level indicating a balanced housing market
Industry professionals generally use this threshold to distinguish between seller-favoring and buyer-favoring conditions in local markets.
~1.5M
Estimated US housing unit shortage
The National Association of Realtors has estimated a structural housing deficit of roughly 1.5 million units, reflecting years of underbuilding relative to household formation.
65%
US homeownership rate (approximate)
The US Census Bureau tracks homeownership quarterly; the rate has historically hovered near this level, reflecting the scale of housing demand across the country.
Local demand is equally situational. School district quality, neighborhood walkability, proximity to employment centers, and even crime statistics all affect how many buyers target a specific area versus adjacent alternatives. This is why two zip codes in the same city can behave like entirely different markets. Tracking the right local metrics helps cut through broad generalizations.
Reading the Signals: What Inventory Levels Tell You
Months of supply is the single most useful number for gauging where power sits in a local market. Industry convention holds that a balanced market - where neither buyers nor sellers have a systematic advantage - sits around 4 to 6 months of supply. Below that threshold, sellers gain leverage; above it, buyers do.
A mid-sized metro area sees a major tech company open a regional headquarters, adding 5,000 jobs in 18 months. Home listings remain roughly flat while buyer demand surges.
A small Midwest city experiences population decline over a decade as its manufacturing base contracts. Listings sit on the market for months, and sellers routinely accept offers below asking price.
A coastal city with strict zoning laws sees robust job growth but persistent housing shortages because new construction is sharply limited by land-use regulations.
Mortgage rates rise significantly over several months, prompting many prospective buyers in a hot suburban market to pause their searches.
Days on market (DOM) is the companion metric. When homes sell within days of listing, demand is outpacing supply. When listings accumulate weeks or months without offers, supply is winning. Watching DOM trend upward or downward over consecutive months signals whether a market is heating or cooling before median prices fully reflect the shift. For a practical guide to interpreting these figures alongside each other, see reading a housing market report.
These signals also matter differently depending on your role. For buyers, rising inventory is welcome relief - more choices and less pressure to waive contingencies. For sellers, tightening inventory is an opportunity to price confidently. For renters tracking whether to transition to ownership, sustained low supply with rising prices may indicate a market where waiting has real costs. Learn more about those dynamics in our renting explained hub.
How External Forces Shift the Balance
Supply and demand in housing don't exist in a vacuum. Several external forces can rapidly alter the balance - sometimes within a single quarter.
Mortgage rates are the most immediate demand lever. When rates rise sharply, monthly payments increase for the same home price, disqualifying some buyers and prompting others to pause. Demand contracts, inventory builds, and price growth slows or reverses. The complication: rising rates simultaneously create a supply constraint when existing homeowners with low fixed-rate mortgages decide not to sell, unwilling to trade into a higher rate on their next home. Understanding how mortgage rates ripple through the market is essential context for any buyer or seller.
Inflation affects both sides of the equation. Higher construction costs reduce builder profitability and slow new supply. At the same time, inflation can erode real purchasing power, softening demand among price-sensitive buyers. See how inflation affects the housing market for a full breakdown.
Economic cycles - recessions, layoffs, or regional industry downturns - can collapse local demand quickly even when physical supply hasn't changed. Conversely, a tech boom or new corporate campus can flood a market with well-compensated newcomers, straining supply overnight. The resulting market conditions ultimately define whether you're operating in a buyer's or seller's market - with real implications for negotiating strategy, offer structure, and timing.
This article is for general informational and educational purposes only and does not constitute financial, legal, or real estate advice. Consult a licensed real estate professional for guidance specific to your situation.
Frequently Asked Questions
Months of supply measures how long it would take to sell all active listings at the current pace of sales, assuming no new homes come to market. Under 4 months typically signals a seller's market; over 6 months signals a buyer's market. It's one of the most reliable indicators of local supply-demand balance.
Local supply and demand conditions differ dramatically based on job markets, population growth, zoning restrictions, and new construction activity. A city with rapid job growth but strict zoning limits tends to see sharply rising prices; a city with population decline and abundant land tends toward lower, softer prices.
Higher mortgage rates reduce the number of buyers who can afford to purchase, softening demand. They can also discourage existing homeowners from selling since they'd trade a low locked-in rate for a higher new one - a phenomenon called the 'lock-in effect' that restricts supply simultaneously.
Yes - real estate is hyperlocal. One zip code can have bidding wars while a nearby neighborhood has homes sitting unsold. School districts, walkability, and local amenities all drive neighborhood-level demand independently of broader city trends.
Housing shortages develop when new construction fails to keep pace with population growth or household formation. Restrictive zoning, high construction costs, labor shortages, and slow permitting processes all limit builders' ability to add inventory, sustaining upward pressure on prices.
Local multiple listing service (MLS) reports, your state's Realtor association, and national databases such as those maintained by the National Association of Realtors publish monthly inventory and sales data. Many real estate brokerage websites also provide market snapshots by zip code or county.
The content on this site is provided for informational purposes only and should not be considered a substitute for professional advice. While we strive to provide accurate and up-to-date information, we make no guarantees regarding its completeness or accuracy. Always consult a qualified professional for advice specific to your circumstances before making any decisions.