

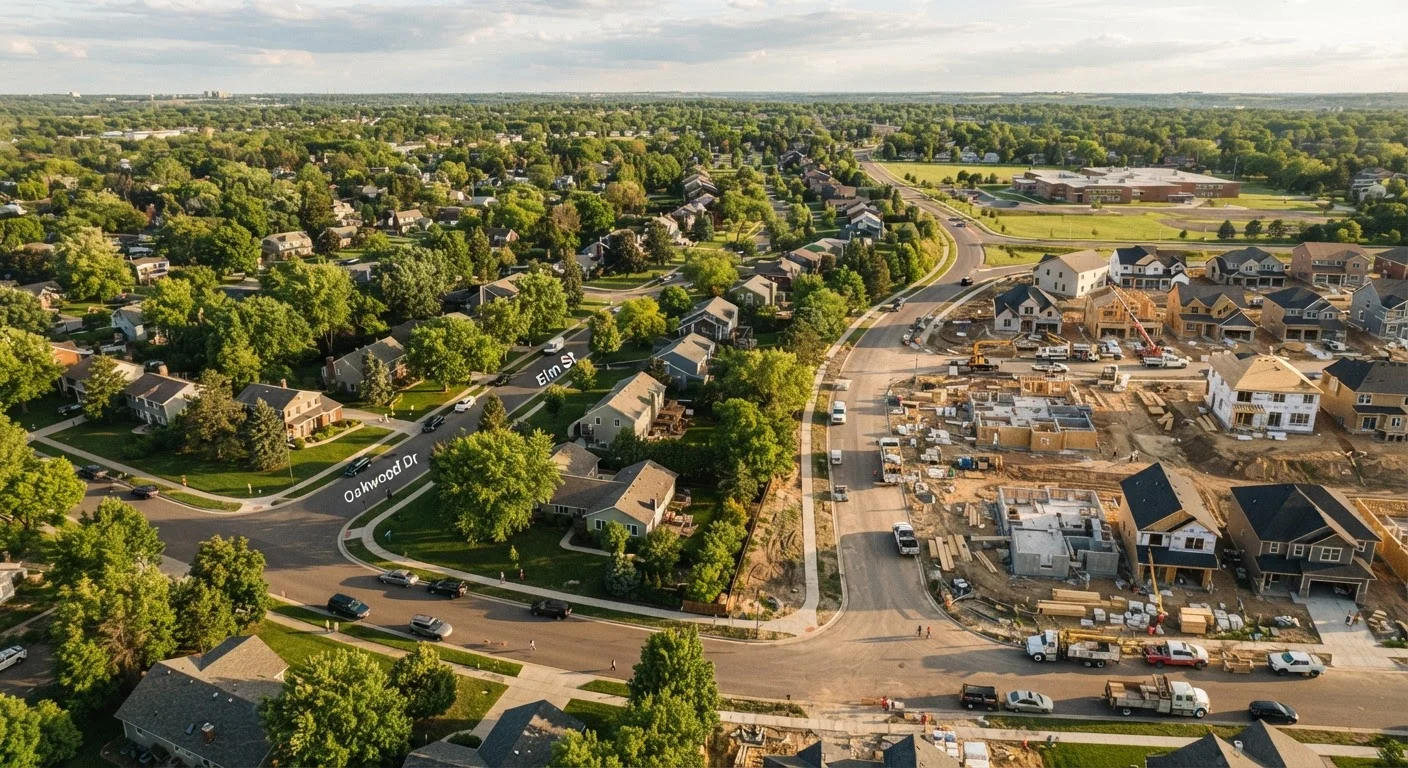
Why Housing Markets Move in Cycles
Real estate does not rise indefinitely, nor does it collapse and stay down. Instead, housing markets follow a cyclical pattern shaped by the interplay of supply, demand, financing conditions, and broader economic forces. Understanding these cycles won't give you a crystal ball, but it will sharpen your ability to interpret market signals and set realistic expectations.
For a broader foundation on how buyers, sellers, and lenders interact to set home prices, see our plain-language walkthrough. The cycle framework builds on those fundamentals.
18 years
Average length of past U.S. housing cycles
Research from the National Association of Realtors and academic housing economists suggests full peak-to-peak U.S. cycles have historically averaged roughly 18 years, though individual phases vary widely.
6-12 months
Typical lag behind broader economic cycles
Housing markets generally respond to economic shifts with a delay, as mortgage commitments, construction pipelines, and consumer confidence adjust gradually rather than immediately.
~30%
Typical peak-to-trough price declines in severe corrections
During the 2007-2012 downturn, the S&P/Case-Shiller national home price index fell approximately 27-33% from peak to trough, illustrating how deep corrections can run in severe cycles.
Phase 1: Expansion (The Boom)
Expansion is the phase most people recognize as a seller's market. Demand outpaces supply, prices climb, homes sell quickly - sometimes above asking price - and new construction activity picks up. Low or falling interest rates, strong employment, and rising consumer confidence typically fuel this phase.
During expansion, inventory shrinks as buyers compete for fewer listings. Bidding wars become common, and sellers hold most of the negotiating leverage. Supply and demand dynamics are at their starkest here: too many buyers chasing too few homes pushes values up.
Expansion can sustain for years when economic conditions are favorable, but it eventually reaches a ceiling where prices outpace incomes and affordability erodes.
Phase 2: Peak and Correction
The peak is the inflection point - prices are at or near their high, activity begins to slow, and the balance of power between buyers and sellers starts to shift. Rising interest rates, affordability strain, or broader economic headwinds are common triggers.
A correction follows the peak. Inventory rises as homes sit on the market longer. Price reductions become more frequent, and sellers must adjust expectations. A correction is not necessarily a crash - it often represents a market returning to more sustainable price levels after an extended run-up.
“Real estate cycles are driven by the same fundamental forces as all economic cycles - credit availability, employment, and sentiment - but they play out more slowly because housing is an illiquid asset with long construction lead times.”
— Karl Case, Co-creator of the S&P/Case-Shiller Home Price Index and housing economics researcher
Understanding the forces behind home prices helps explain why corrections happen and how deep they can run. Factors like local job markets, lending standards, and housing supply all shape the severity.
Phase 3: Recovery and Expansion Restart
Recovery begins when the market finds a floor - prices stabilize, buyer confidence gradually returns, and activity picks back up. This phase is often slow and uneven. Some neighborhoods recover faster than others, and affordability improvements (through price declines, lower rates, or rising incomes) draw buyers back in.
Builders become more cautious during recovery, which means new supply remains limited. That restraint often plants the seeds for the next expansion phase as demand eventually outpaces the available inventory again.
Focus on Local Data, Not Just Headlines
National housing statistics can mask significant variation at the city, county, and even neighborhood level. A market in recession nationally may still be expanding in areas with strong local employers. Before drawing conclusions about your market, look at local inventory trends, median days on market, and price-per-square-foot data from sources like your regional MLS or local real estate reports.
Recognizing recovery signals early - such as declining days on market and rising pending sales - can be valuable for buyers and sellers alike. Our guide on market heating and cooling signals covers these indicators in detail.
Whether you're navigating a home purchase or evaluating your renting options, cycle awareness helps you interpret the market environment around you - even if it can't tell you precisely what comes next. For a reality check on common misconceptions, see our article on housing market myths that can mislead buyers.
Frequently Asked Questions
Housing cycles don't follow a fixed schedule, but historically they have ranged from roughly seven to eighteen years from peak to peak. Local economic conditions, interest rate environments, and housing supply constraints all influence the duration of each phase.
No one can reliably predict the precise timing or depth of a market correction. Analysts look at indicators like price-to-income ratios, inventory levels, and lending standards, but these signals point to vulnerability, not certainty. Caution is warranted whenever those indicators flash warning signs.
Both phases can offer opportunities depending on your financial situation, timeline, and local market. Corrections may bring lower prices but also tighter lending and economic uncertainty. Recovery phases often mean rising prices but improving confidence. Your personal readiness matters more than cycle timing for most buyers.
No. Real estate is inherently local. A city experiencing a tech-sector boom may be in expansion while a nearby region shedding manufacturing jobs enters correction. National data is a useful backdrop, but local market research is essential for real decisions.
Interest rates directly affect affordability. Rising rates typically slow buyer demand and can tip a peak market into correction. Falling rates tend to stimulate demand and can accelerate a recovery. However, rates are just one of several forces shaping cycle dynamics.
The content on this site is provided for informational purposes only and should not be considered a substitute for professional advice. While we strive to provide accurate and up-to-date information, we make no guarantees regarding its completeness or accuracy. Always consult a qualified professional for advice specific to your circumstances before making any decisions.